BACK TO SERIES INDEX

Failing and Succeeding: Analysis of the St. Louis Food Ecosystem
Dr. Anita ManionStephen Bagwell
Introduction
Food City set out to learn how people accessed food in an attempt to understand the impact of geography, poverty, and race on food availability. Throughout 2023, the Food City team administered surveys at community events and through semi-random sampling in the St. Louis metropolitan area. Questions are primarily geared toward understanding the availability of food choices and the effect that socioeconomic status has on shaping individual decision making. What challenges do people in the St. Louis area face? Are those challenges equally distributed across race, income, and gender?
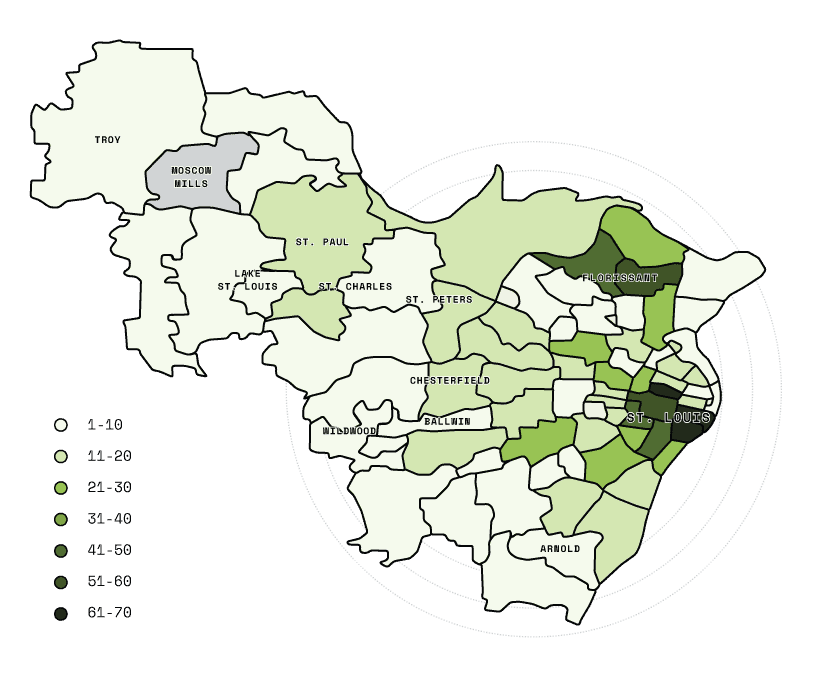
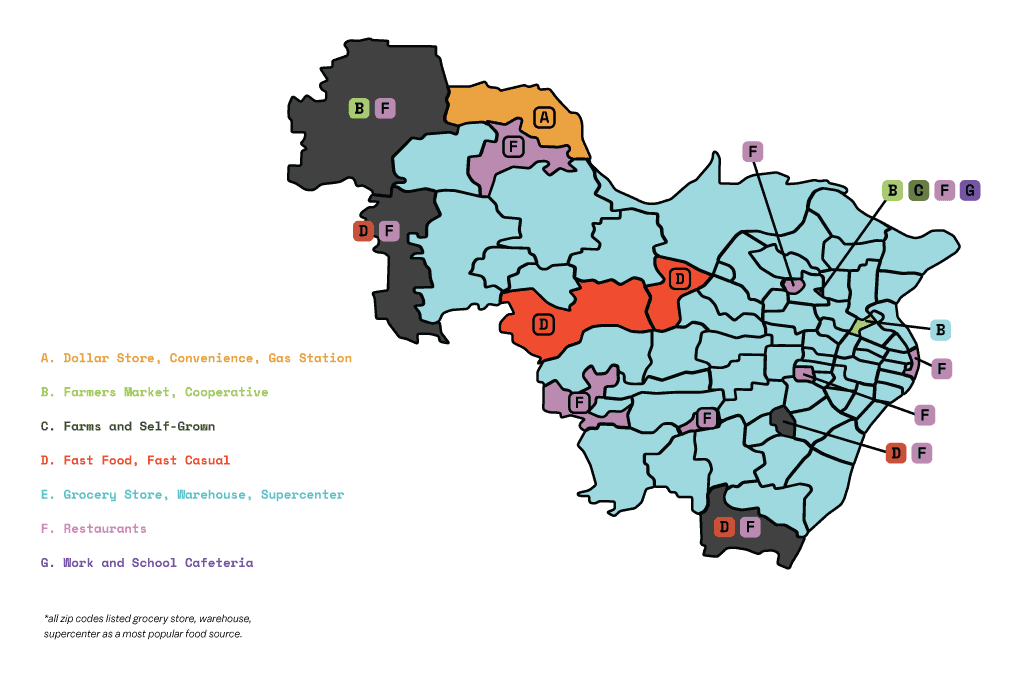
Number of Respondents by Zip Code
Food Choices and Availability
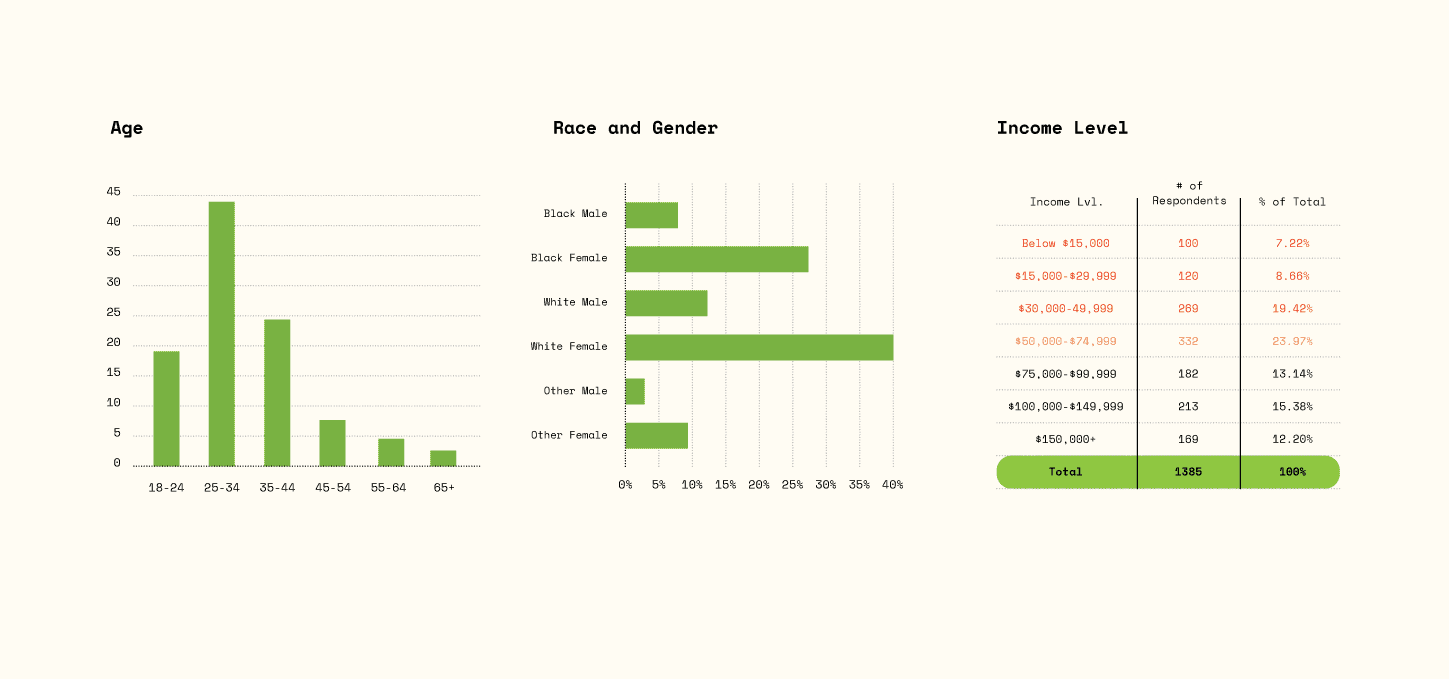
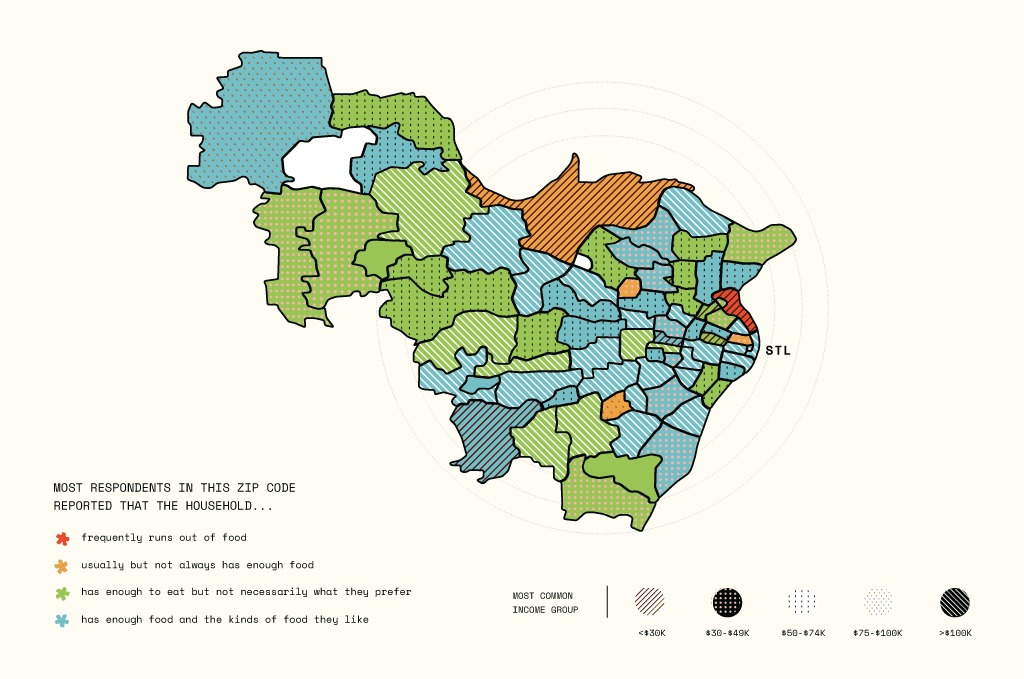
When asked which statement was most accurate about their household food choices, a plurality of respondents said their household has enough food and the kinds of food they want to eat. However, for over half of the respondents that was not the case. While it might seem reassuring that only 3.2% of households said they frequently run out of food, when we consider the effects of income on these responses, we find significant disparities. For households with income below $15,000, 7.5% of respondents indicated that they frequently run out of food.
The percentages are similar for households with income of $15,000-$29,999 (6.1%) and $30,000-$49,999 (6.3%). Overall, households at or below the poverty line were more than twice as likely as other respondents to say they frequently ran out of food. For households with incomes of $50,000-$74,999, we see a decline to 2.8%, and for those making $75,000 or above, the figure is below 1%.
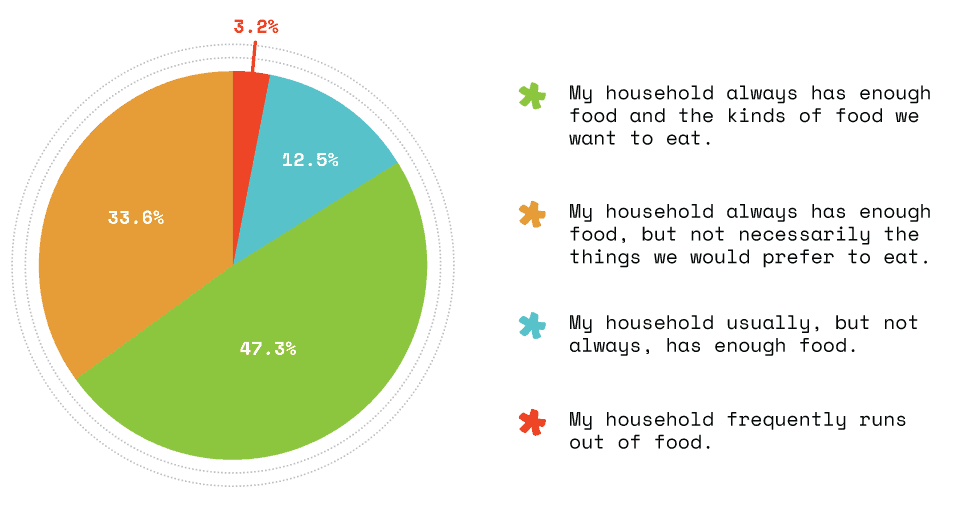
a plurality of respondents said their household has enough food and the kinds of food they want to eat. However, for over half of the respondents that was not the case.
Regional Economic Development
Roughly a third of respondents, and over half of those who answered the question, indicated that they would eat differently if money were not a factor. Common themes in the open-ended responses included buying more from locally owned grocery stores, eating healthier, and being more likely to cook at home rather than eat for convenience. Geographic access to locally owned grocery stores was also highlighted. Respondents indicated that they felt local grocery stores were more expensive and often inconveniently located, thus it was more cost effective and easier to shop in larger chains and big box stores. If more locally owned grocery stores were present in the community, respondents indicated they would be more likely to shop there. One respondent indicated that they “had to drive further for healthy options,” while another said they “sacrifice other personal things to make sure good food is in the budget,” adding, “I drive long distances to grocery shop.” Perhaps the most common response pertains to how income impacts respondents’ ability to purchase healthy foods. One respondent said, “100% we would eat differently. While we make decent money, we still have bills to pay and can’t devote all of our money to buying healthy and nutritious foods. If it wasn’t a factor, I would try and eat all natural and organic from locally sourced markets and farms (local butchers, etc.).” This was a typical response, highlighting that even those who feel their income is decent still struggle to access and afford healthy and nutritious foods. Another respondent said, “If money was no object, I would be able to provide the healthy and natural foods needed.” Cooking more at home or eating more nutritiously when going out was another recurring theme in the responses. One respondent indicated that they would cook more healthy meals at home with fresh vegetables, and another highlighted how income limits for government programs like food stamps alter healthy behaviors in negative ways, saying “Yes I would be more healthy, probably cook at home a lot more. Just like I did when I was on food stamps, I cooked at home a lot more.”
“…we still have bills to pay and can’t devote all of our money to buying healthy and nutritious foods. If it wasn’t a factor, I would try and eat all natural and organic from locally sourced markets and farms, local butchers, etc…”
- Anonymous Survey Respondent
Designing the Future of Food

When we asked respondents what was missing from their communities, several common themes arose. These include the need for fresher produce through things like community gardens, farmers’ markets, and better grocery stores; better health and nutrition education; and affordable healthy options.
Gardens, primarily community, but also personal, appear to be a major desire within the St. Louis food ecosystem. Respondents frequently mentioned them as something they felt was missing, highlighting how they improve food access, provide healthy options, and develop a sense of shared responsibility and community. One respondent said that community gardens or cooperatives “could provide opportunities for residents to grow their own produce, fostering a stronger sense of local sustainability.” Another indicated that community gardens could be useful to the entire St. Louis metro area. Farmers’ markets were also frequently highlighted as missing, as respondents see them in nearby communities and think having better access to them would improve lives in their community as well. Respondents in Florissant and Carondelet specifically pointed to opportunities in nearby Ferguson and Soulard as something they wish they had. Another respondent said, “Community gardens and farmers’ markets would be beneficial to my neighborhood and others across the metro. These amenities/resources do exist, but not in a way that can serve all consumers, especially low-income communities.”
Finally, a third related theme highlighted by respondents was the lack of education about what nutritious options exist, how affordable they are, and how they can be accessed. Simply put, respondents indicated “food education” over and over again, in a variety of ways; they specifically cited “access to free produce and education on healthy eating,” “community education classes based around nutrition and healthy living,” and “food education and culinary training resources.” Similarly, another respondent, in addition to hoping for healthier grocery stores or community gardens, said “more marketing and advertisement of these opportunities,” adding that “so many St. Louis gems are hidden within neighborhoods and they never grow because people don’t know about them.” Even when opportunities for healthier eating exist, many individuals do not know about them because of a lack of education, marketing, and general awareness.
As one respondent noted in detail, “In my ideal neighborhood, I would love to see a diverse array of food resources and amenities that cater to the diverse tastes and needs of the community. First and foremost, a vibrant farmers’ market would be a cornerstone, providing access to fresh, locally grown produce, artisanal products, and a platform for small-scale food entrepreneurs. It would also be wonderful to have a community garden where residents can grow their own food and connect with neighbors who share a passion for gardening. Additionally, a range of dining options should be available, from family-friendly restaurants to cozy cafes offering international cuisines and healthy, sustainable menu choices. A well-stocked grocery store with organic and locally sourced products would be essential, making it convenient to shop for everyday essentials. Finally, cooking classes and educational programs focusing on nutrition and sustainable cooking practices would empower the community to make healthier and more environmentally conscious food choices. These amenities would not only nourish the body, but also foster a sense of community and promote food sustainability in our neighborhood.”
This survey report has highlighted a number of challenges faced by the St. Louis community. Much of the remainder of the book, written by a diverse set of contributors across the food ecosystem, identifies ways in which individuals and organizations are making progress confronting these challenges.
Data Limitations
We want to acknowledge that the survey suffers from several limitations common in survey research. Most importantly, there is a possibility that answers may be biased due to self-reporting and from the sampling technique. Self-reporting bias might be especially relevant in terms of indicators related to income and hunger, such as over-reporting income or under-reporting lack of nutritious choices. Due to the nature of the sampling technique, it is possible that these respondents are not representative of the St. Louis metropolitan community population. However, given the distribution of incomes across the sample, we think this broadly mirrors the distribution of government statistics.
Finally, there are a number of factors that were not accounted for in the survey — including the explicit question of race and educational attainment. While we were able to employ a method to slightly overcome the lack of self-reported race data, asking a question that specifically encourages respondents to identify which race(s) they identify with would allow a better understanding of the intersection of race, sex, and income on the food ecosystem in St. Louis. Aggregation to the zip code level may additionally obscure some geographic factors that could be better understood at the neighborhood or census tract level, which could provide more nuance.